Selecting and Highlighting difference using Excel Go To Special Row / Column Difference
Until now we have seen a couple of ways to compare the data. We have seen the more traditional way to compare and highlight differences in rows using conditional formatting and also the quicker way meant to do it using cell rules.
But there is yet another way to compare the data for selecting and highlighting (if you choose) differences. So lets get to it straightaway.
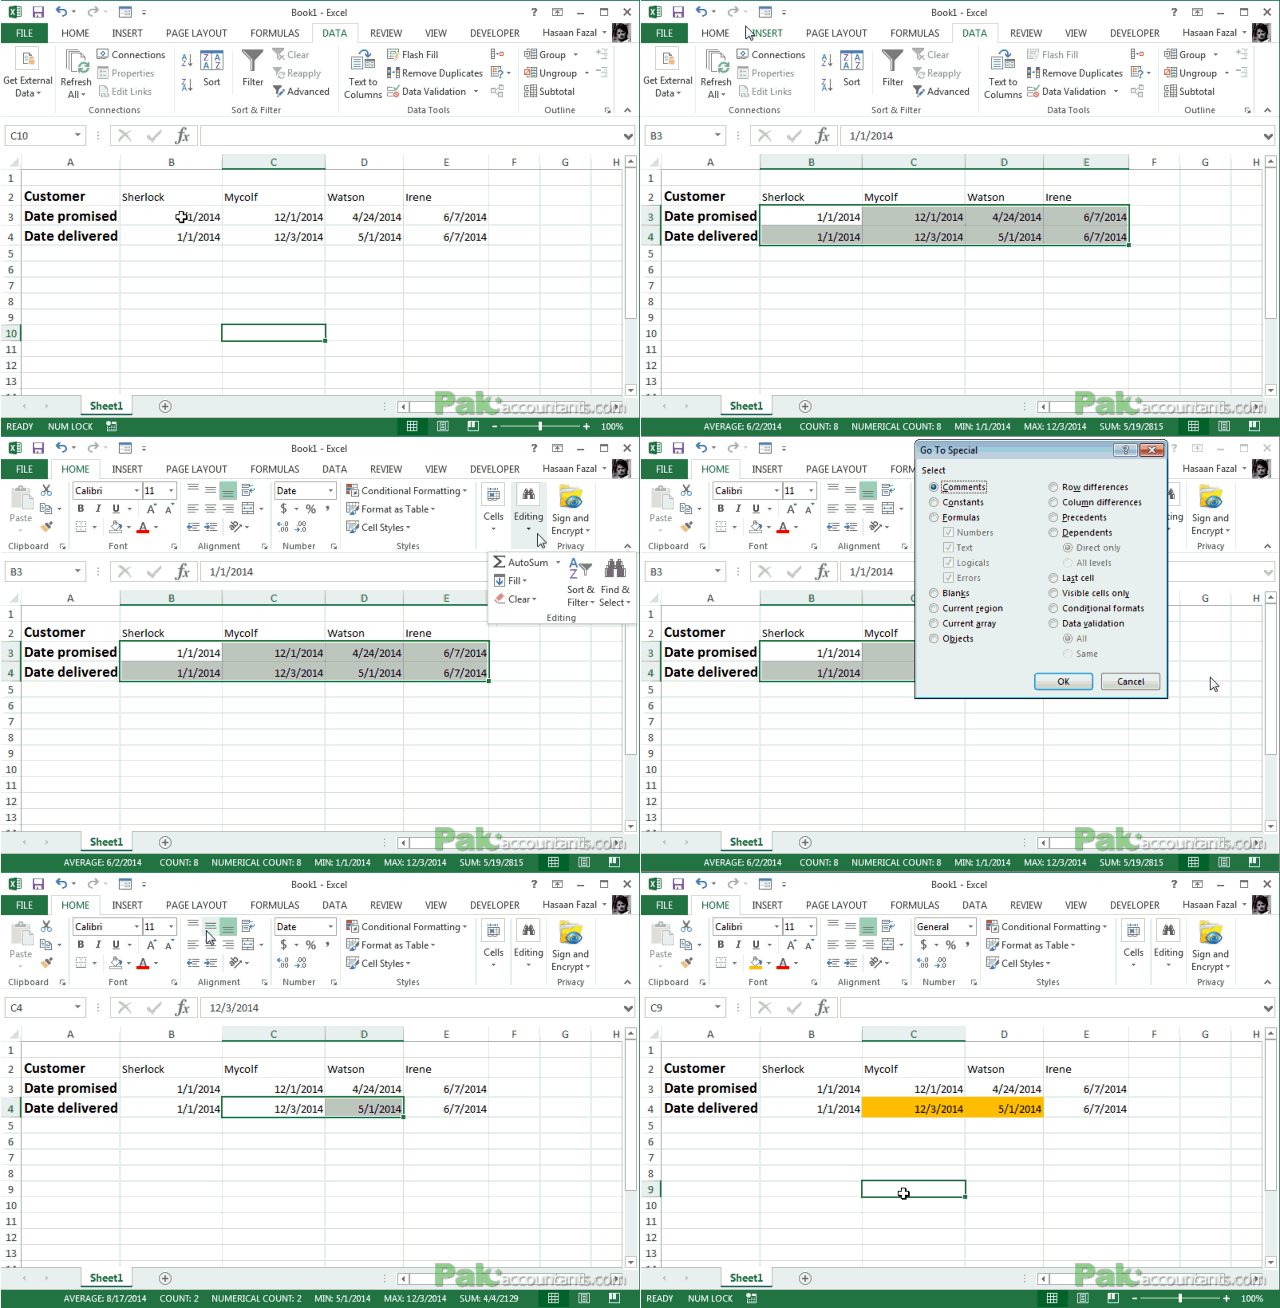
Following is the example data where we have customers, the promised dates of delivery and the date at which order is actually delivered. We want to highlight the orders that reached customers late.
Step 1: Select the two columns containing dates i.e. both date promised and date delivered.
Step 2: Go to Home tab > Editing gorup > Click Find and select drop down button > Go to special > from the dialogue box select row difference and hit OK button.
Step 3: Excel will select the rows that are different in date delivered column compared to date promised column. You can simply highlight them either by changing cell fill color or text color.

Bonus Tip: Sort/Filter using color
After you highlight the data you can apply sort or filter feature to get just the data you want. Its super easy once we know the differences and having them highlighted.
Just select the data and hit Ctrl+Shift+L to apply filter and from the date delivered drop down filter arrow you can filter the rows just with particular colors.

Important: Limitations of Row difference
As you can see above that it only highlights the difference in the subsequent columns’ rows compared to the first one in the selection and also data needs to be arranged in such manner otherwise it won’t work. That is why it might work for some but not for everyone for comparison purposes.
For example if the data is arranged in row format and the data to compared is actually in columns, the row difference won’t work. However we do have column difference too for this.


Leave a Comment