Creating a Steps Chart in Excel
Creating a Steps Chart in Excel
Bottom Line: Learn to create a chart that displays progress when steps are completed.
Skill Level: Beginner

Excel Files
Follow along with the video and build your own steps chart. I've included both the BEFORE and AFTER files for your convenience.
Watch the Tutorial
Types of Progress Charts
I recently created a post called 8 Types of Progress Charts and promised to build out tutorials for each of the 8 chart types.

Our first chart was the gauge chart. In this post, we're looking at how to build a steps chart.

A steps chart just measures progress toward the end goal when that progress is made in steps, tasks, or milestones.
Building the Steps Chart
Let's get started!
Start with the Source Data
The first thing we need is source data. You'll want to use an Excel Table for the chart so that it is dynamic and you can easily add or subtract steps. If you're not familiar with Excel Tables, watch this video: Excel Tables Tutorial Video
We want three columns for our table, and as many rows as there are steps, plus a header row. For my example, I'm selecting the area from J2 to L8.
Go to the Insert tab and select Table. Then hit OK. Excel will create a blank table in that specified area.

Steps Column
The first column will be Steps, and it contains a list of numbers representing each step. Now, we could just type in the numbers 1 to 6, but instead, we will write a formula so that it will automatically continue if we add more steps later.
Our formula is =ROW()-ROW(TableHeader), where TableHeader is just a placeholder for whatever your actual Table Header name is. Basically, this formula tells Excel to subtract the header row number from the current row number.
Grey Column
The data in this column represents the grey bar in the background of the chart. The cells in the column will all have the number 1 in them. But don't type 1 in each box. Instead, type =1 and let the formula copy down.

Complete Column
Our third column will be for Complete, and it represents the colored portion of the chart. We will use the IF Function for this column. If you are not familiar with the IF Function, watch this tutorial: Everything You Need To Know About The If Formula In Excel
Our formula for this column is =IF([@Steps]<=$O$2,1,NA()). This formula tells Excel to look at the value in the cell labeled Complete, and if it's greater than or equal to the current row, return a 1. If it's not, return a #N/A error.

Create the Chart
Now that our source data is complete, we can build the chart itself. With the Grey and Complete columns selected, go to the Insert tab. From the Line Chart menu, choose Line with Markers.

Now we will format it to look the way we want it. Remove the legend. Then choose the “Grey” series (from the Format tab or by clicking on the blue section of the line). Then click on Format Selection on the Format tab. That will bring up a Format Data Series pane on the right. Select the Fill & Line options button.
Update the Line settings to be:
- Solid Line
- Color: Grey
- Width: 10 pt

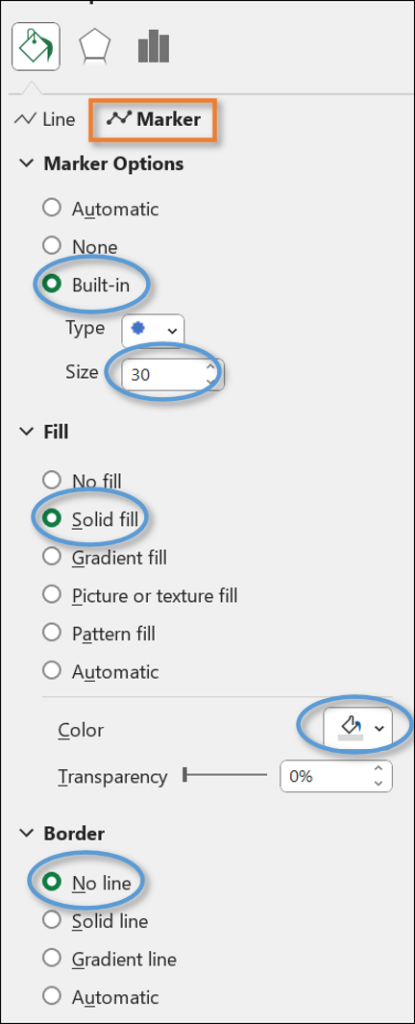
For the Marker settings, choose:
- Marker Options: Built-in
- Size: 30
- Fill: Sold fill
- Color: Grey
- Border: No line

Your chart will look something like this

Now repeat the formatting for the “Complete” series, except, choose a different color. I used green.

Almost there! Let's add the step numbers to the markers.
Add Labels
With the “Grey” series selected, click the plus symbol (+) at the top-right corner of the chart. Next, select the menu to the right of Data Labels, and click on More Options.

That will open a Format Data Labels pane to the right of your worksheet. Under Label Options, select Value From Cells.
This will open a box titled Data Label Range. Select the data under the Steps header in your first data column.

Then hit OK.
In the Format Data Labels pane, uncheck Value and Show Leader Lines. Then change the Label Position to Center.

Your chart now has data labels! Of course, feel free to format the text of the labels however you like. For example, I made the font bigger, bold, and white.

Format and Remove Axis and Gridlines
Next, right-click on the vertical axis and select Format Axis.

Then in the Format Axis pane that opens up, change the Maximum to 2.

That will center your chart vertically. Now you can remove the axes and gridlines. Your chart should now look like this:

Finally, rename or remove the chart title to your preference. You can also reduce the size of the chart vertically to get rid of some white space.

The great thing about this chart is that it's completely dynamic. If you change the number of completed steps, the chart will automatically fill or empty those steps of color. If you add or remove steps, the line will increase or decrease in size.
Implementing the Chart
Let me show you a couple of practical ways this chart can be used. The first way is a checklist.
Steps Chart for Checklist
To accomplish this checklist, I have two hidden columns with data in them. The first column has TRUE and FALSE values linked to the checkboxes. The second column has just one field where I've written a formula that adds up the TRUE values (1) and the FALSE values (0) and multiplies it by 1. That gives the total number of boxes checked. The chart can be linked to that value.

If you could use some help making a checklist, I have a tutorial here: Checkbox Tutorial Using Conditional Formatting
Steps Chart for Report or Form
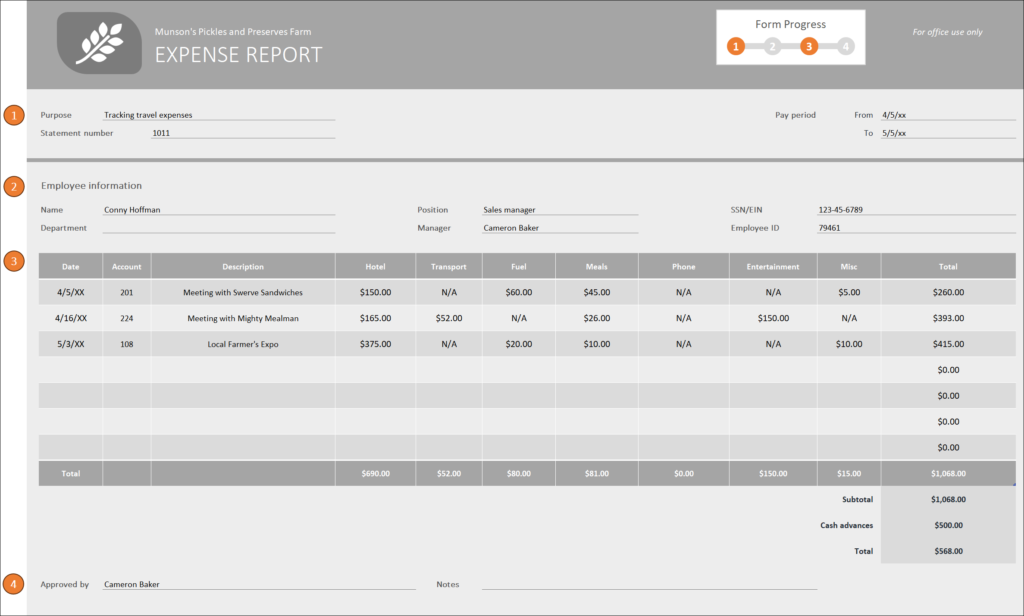
Another instance where you could use a steps chart is on a form that requires sections to be filled out. Here is an expense report where the steps are colored as certain fields are filled in.


These TRUE and FALSE statements can be linked to the steps chart, and as you can see, this form allows steps to show as incomplete, even if later steps are complete.


Leave a Comment