Making Horizontal Dot Plot or Dumbbell Charts in Excel – How To
Making Horizontal Dot Plot or Dumbbell Charts in Excel – How To
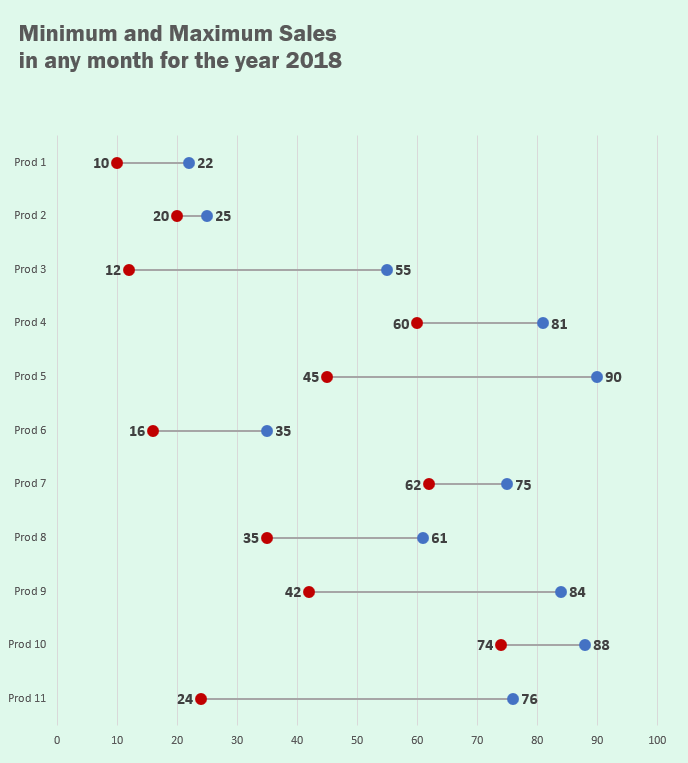
Dumbbell charts also called connected dot plot or DNA chart or lollipop charts are not available as builtin charts in Excel by default. But they prove awesome visual aid in certain situations. A great alternative to conventional clustered bar charts as they save space and keep the competing values in the same line.
Here is an example comparing minimum and maximum sales of different products during the period:

I’m not really sure but so far every tutorial I have come across uses some kind of complex method or uses scatter chart to make dot plots in Excel. Well they have reasons but today I am attempting to make fully functional and working dot plot using bar charts! Yup dot plots are meant to replace them so why not! So lets start!
Dot Plot / Dumbbell / Lollipop / DNA Chart in Excel – Step by step
Download the Excel workbook that contains dummy data so that you can follow along and learn the techniques applied in this Excel tutorial.


Leave a Comment