Actual vs Target Variance Charts in Excel with floating bars
Actual vs Target Variance Charts in Excel with floating bars
So we are making this awesome Excel variance graph, the easiest actual vs target chart with floating bars, in 5 steps under 1 minute:
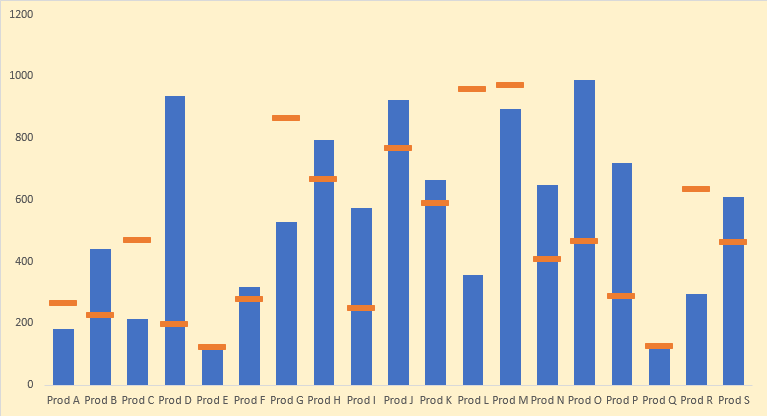
Excel Actual vs Target chart in 30 seconds or less!
Download this Excel workbook containing sample data and follow the steps in this tutorial to learn the technique better.
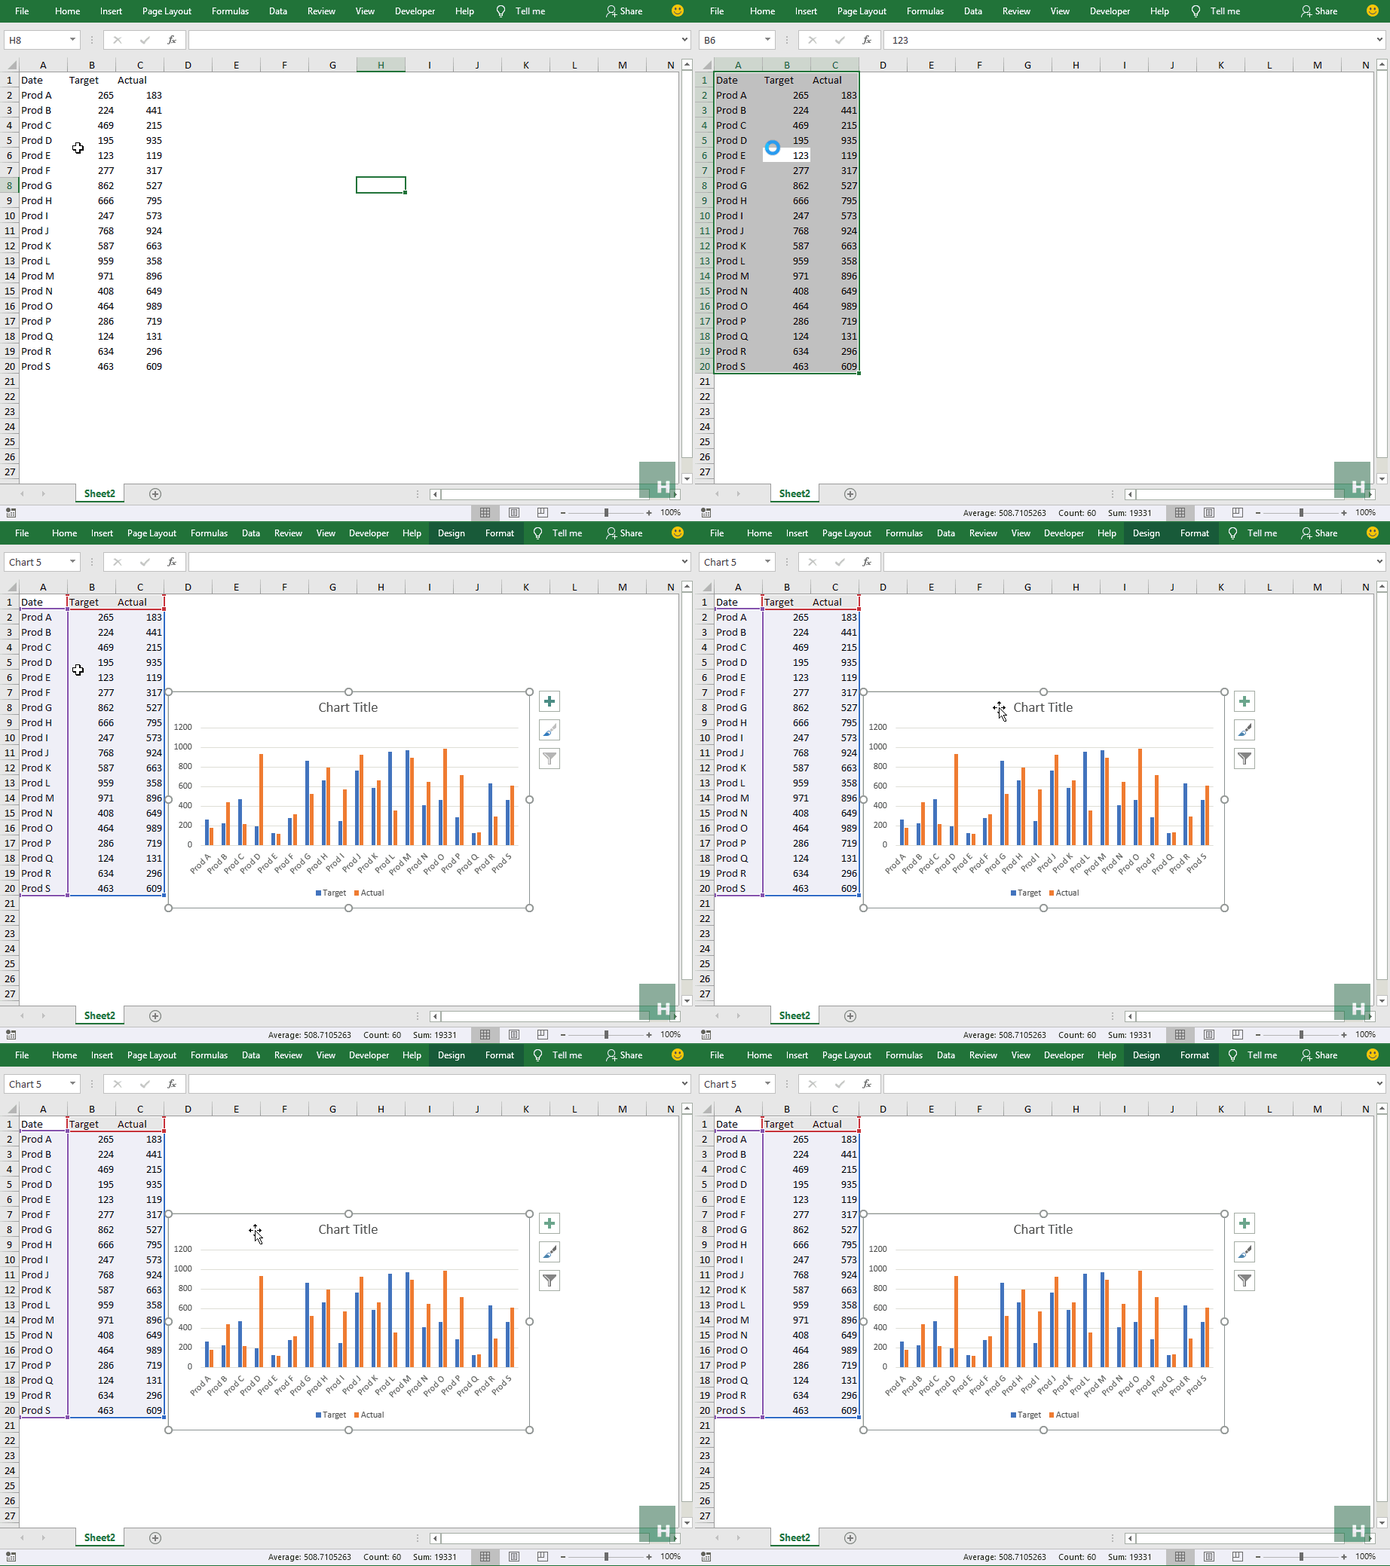
Step 1: Have an active cell inside data and Hit CTRL+A to select the data and then hit ALT+F1 to insert clustered column chart instantly.
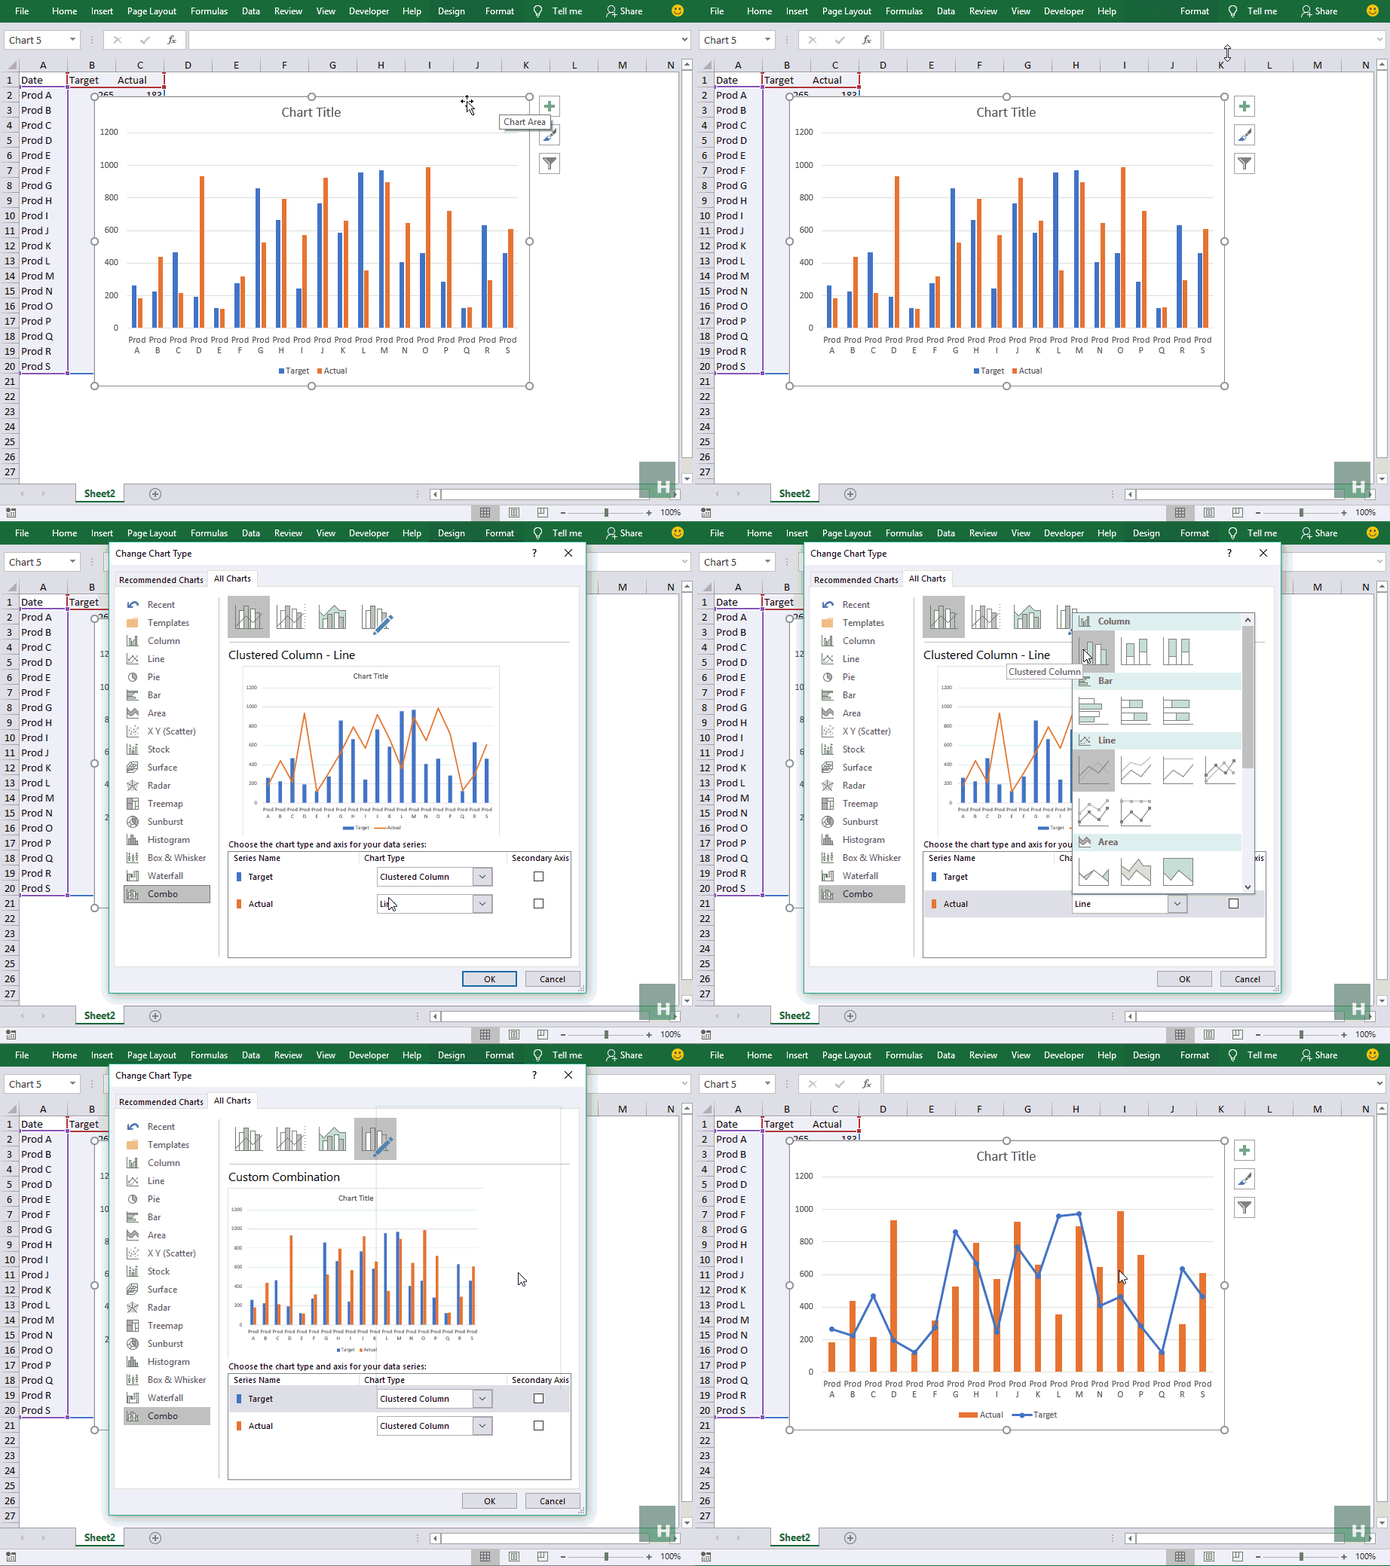
 Step 2: Having the chart active, go to design tab > click change type button. A new window will pop up. Select combo from the list on the left > change chart type for target series line with markers > Click OK.
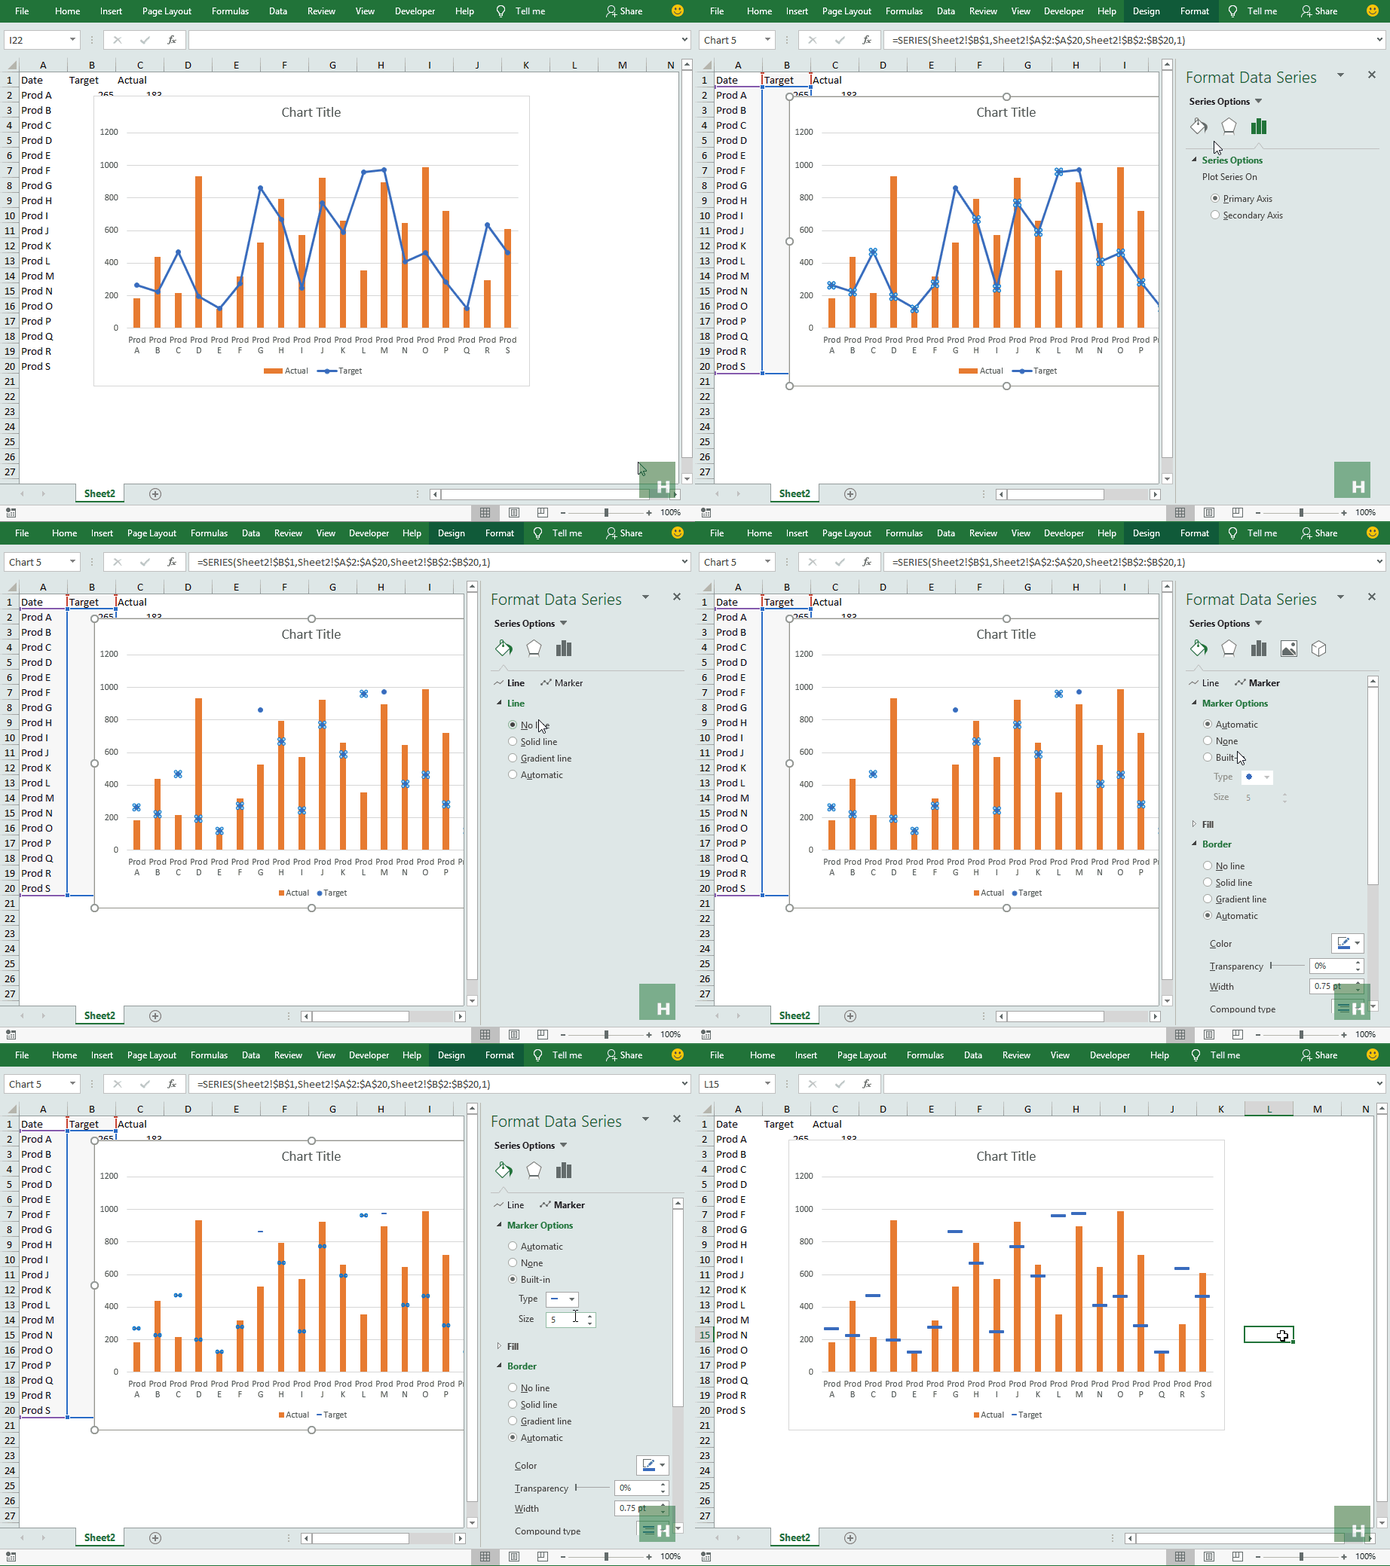
 Step 3: Right-click on the line series in chart > Click Format data series > From the bar on the right click Fill and line icon > Under line select No line
Step 4: Click Marker > Expand Marker options > Click Built-in > From the drop-down select the marker you like, I went with dash as its more visible on the chart. Increase the size to 15.
 Step 5: Remove the chart elements you don’t need. I removed almost everything from title, label, and gridlines to have the following result:
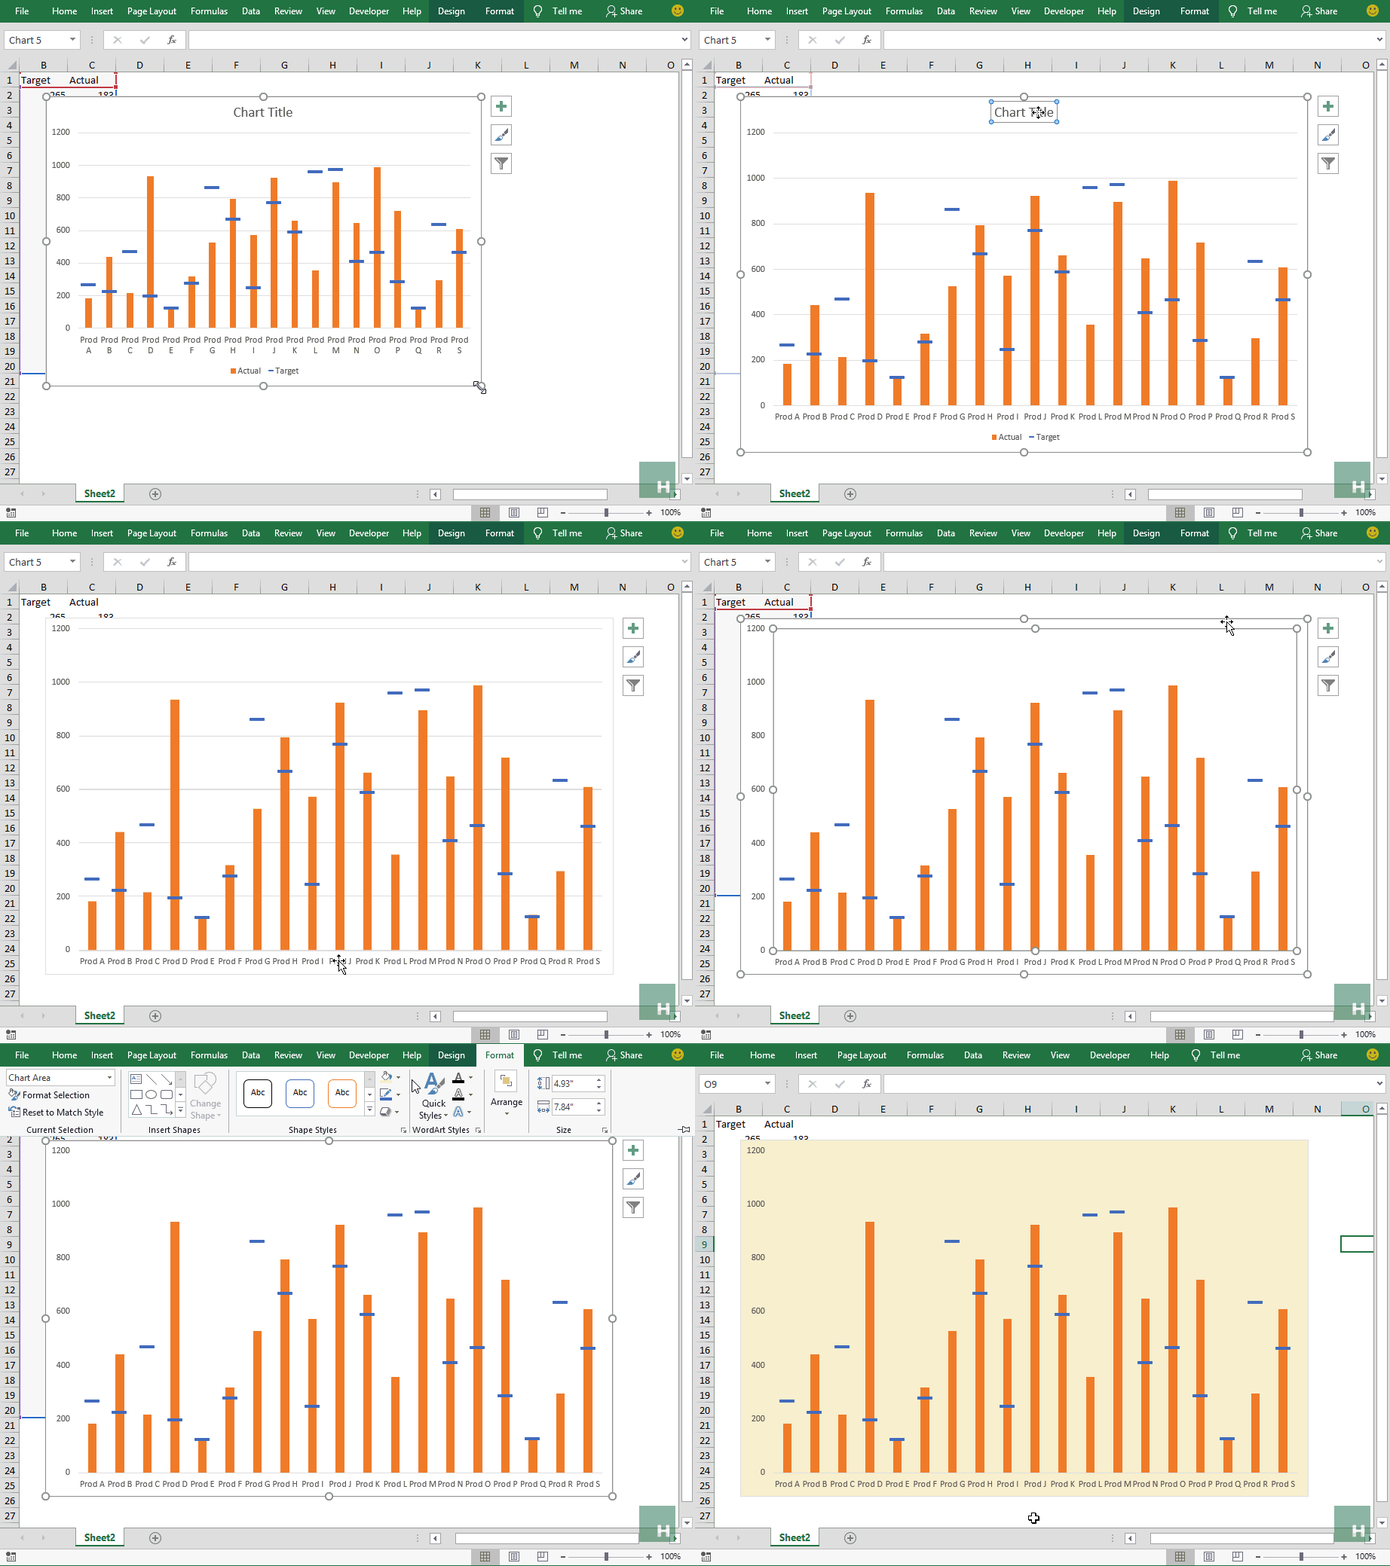
Blazing fast charting in Excel! I mean accountants and analysts have a lot to rejoice and this is one example 🙂
Liked the tutorial? Pin it!


Leave a Comment