Stock & Exchange Rate History in Excel
Stock & Exchange Rate History in Excel
A new STOCKHISTORY function debuted in the beta channel of Excel for Office 365 last week. The function is able to pull historical stock prices and exchange rates at a daily, weekly or monthly interval.
STOCKHISTORY is an example of one of the new Dynamic Array formulas. A single formula will spill into adajent cells. For an overview of Dynamic Arrays, read Excel 2019: Dynamic Arrays Can Spill article.
Caution
STOCKHISTORY will only be available in subscription versions of Office 365. If you own Excel 2013, Excel 2016, Excel 2019, (or in the future, Excel 2022) you will not have access to the STOCKHISTORY service.
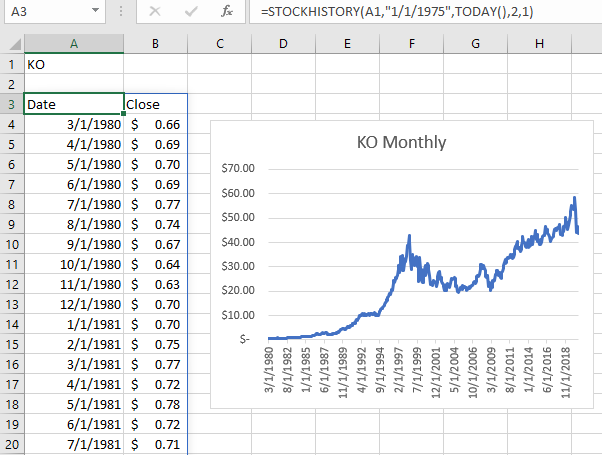
Here is an example of a STOCKHISTORY formula returning monthly closing prices for the Coca-Cola stock closing price:
=STOCKHISTORY(A1,"1/1/1975",TODAY(),2,1)
You can use the arguments in the STOCKHISTORY function to provide flexibility. It is worth learning the various options. The arguments are presented in order:
- Stock: This could be text in quotes such as “IBM” or pointing to a cell such as A1.
- Start_Date: wrap the start date in quotes or point to a cell containing a date. As you will see in the example above, if you specify a start date from before the stock was trading, the results will start at the oldest date available.
- End_Date: if you leave this off, it defaults to today’s date. Note that the function does not provide intra-day results so in most cases, the latest date will be yesterday’s close. STOCKHISTORY does not show today’s closing price until many hours after the market closes.
- Interval: This provides a lot of flexibility. Type 0 for daily, 1 for weekly, or 2 for monthly
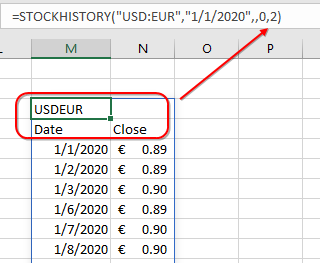
- Headers: Enter 0 to return the data without column headers. Use 1 for a single row of headers as shown above. Use 2 to get headers as shown below.

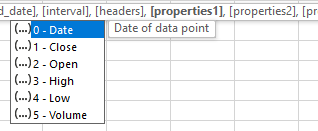
STOCKHISTORY function arguments - After the first five arguments, you can specify up to 6 additional arguments to specify what fields you would like to return and the order. If you leave these out, you will get date and closing price.

STOCKHISTORY function arguments
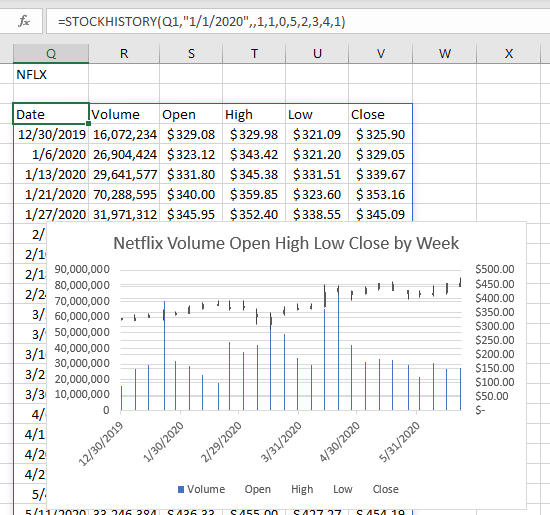
You can specify the values in any order. For example, one of the very old built-in stock charts in Excel requires Date, Volume, Open, High, Low, Close. In this case, the 6th through 10th arguments would be 0,5,2,3,4,1.

STOCKHISTORY supports individual stocks, Currency Pairs, ETFs, Index Funds, Mutual Funds, and Bonds.
#evba #etipfree #eama #kingexcel📤How to Download ebooks: https://www.evba.info/2020/02/instructions-for-downloading-documents.html?m=1


Leave a Comment