Visio for Excel Free Add-in
Visio for Excel Free Add-in
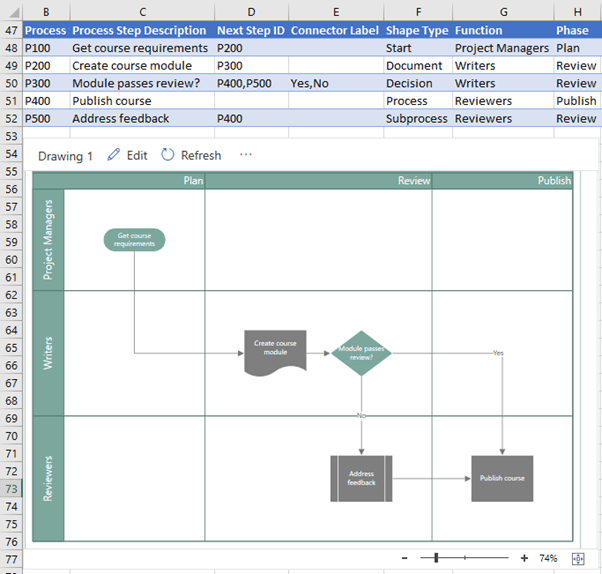
Office 365 users now have access to the free Visio data visualizer add-in enabling you to create Excel flow charts linked to cells like this:

And org charts like this:

And because they’re linked to cells, you simply refresh the connection and the diagrams update!
Watch the Video

Download Workbook
Download the Excel Workbook and follow along. Note: This is a .xlsx file please ensure your browser doesn't change the file extension on download.
Create Excel Flow Charts Linked to Cells
First you need to download the Visio Data Visualizer add-in*:

*Requires Office 365.
Note: It’s currently in Preview, which means it will continue to be developed over the coming months, but you can do a lot with it already.
Using the Visio Data Visualizer
To insert a flow or org chart first, select an empty cell in your worksheet. This is where some sample data will be placed. The sample data allows you to see the layout required for your linked data.
Then go to the Insert tab > My Add-ins > Microsoft Data Visualiser:

Note: The add-in will ask you to login to your Office 365 account…yes even if you’re already logged in inside of Excel! Signing in unlocks capabilities in Visio for the web such as printing, sharing, and viewing in the browser. You don't need a Visio subscription to use this add-in, but if you have one, you'll also be able to make edits to your diagram.
The dialog box opens where you choose the type of diagram you want:

Note: If you're signed in, the diagram is saved as a Visio file in your OneDrive or SharePoint location. If you're not signed in, then the diagram is part of your Excel workbook. You can always choose to create a Visio file by signing in.
When you select the diagram you want, it inserts a sample diagram and its data-linked table:

All you need to do now is replace the data in the table with your own, then click the ‘Refresh’ button in the header of the diagram
You can add as many rows as required or remove any rows from the sample data that you don’t need.
Notes:
- If there is an issue with the source data table, the Data Checker will appear with instructions on how to fix the issue. After you modify the table, select Retry in the Data Checker to confirm the issue is resolved. Then you'll see the updated diagram.
- Clicking the Edit button will ask you to open it in Visio. This requires an Office subscription with a Visio licence.
Visio Flowchart Linked Table
The structure of the table inserted by Visio must be retained. The flowcharts have the following fields:
- Process Step ID: compulsory unique identifier for each step in the process.
- Process Step Description: this text appears on the shape
- Next Step ID: Optional next step. Determines the next shape in the flow
- Connector Label: Optional where there are multiple next steps
- Shape Type: There’s a range of shapes to choose from, including 4 custom shapes (see image below)
- Function: The flowchart row labels
- Phase: The flowchart column labels available in cross-function flowcharts

Note: There’s currently no way to edit the flowchart title inside of Excel. Let’s hope this will be rectified in an update.
Format Visio Flowcharts
The Visio flowcharts in Excel are like any other object. Clicking the outside will enable the pull handles allowing you to resize it, delete it or cut and paste it to a new sheet:

Sharing Visio Flowcharts
Save your Excel file on OneDrive or SharePoint and from there you can easily share your diagrams via the Visio for Web interface. Click on the ellipses in the top of the diagram > Open in Web:

Note: If you're not signed in yet, you'll be prompted to sign in with your Microsoft 365 or Office 365 work or school account.* Select Sign in and then Allow or Accept on any permission prompts.
* It isn't available for personal Office 365 accounts (hotmail.com, outlook.com, live.com, msn.com).
This opens the diagram in Visio for the web in your default browser. Select the Share button (see image below) to create a link or to enter the email addresses of those you want to share with. All Office 365 users will be able to view the diagram in their browser.

Alternatively, if you want to share both the data and the diagram, share the Excel workbook that contains the diagram with others. To share it, attach the workbook to an email message, or save it in OneDrive and then use the Share button to send a link.
Lastly, you can print the diagram or create a PDF from the ellipses in Visio for the Web:

📤How to Download ebooks: https://www.evba.info/2020/02/instructions-for-downloading-documents.html?m=1


Leave a Comment